 Universo Viviente
Related Articles


Title: Hubble’s Andromeda Panchromatic Treasure: The Extended Triangle Region (PHATTER) II. The recent spatially resolved star formation history of M33
Authors: Margaret Lazzarini, Benjamin F. Williams, Meredith J. Durbin, Julianne J. Dalcanton, Adam Smercina, Eric F. Bell, Yumi Choi, Andrew Dolphin, Karoline Gilbert, Puragra Guhathakurta, Erik Rosolowsky, Evan Skillman, O. Grace Telford, Daniel Weisz
Institution of the first author: California Institute of Technology, 1200 E California Blvd., Pasadena, CA 91125, USA
Status: Accepted in the Astrophysical Journal, in press.
The Panchromatic Hubble Andromeda Treasury (PHAT) team has already achieved the impossible. Led by Professor Julianne Dalcanton (read our interview with her from #AAS233 here!), PHAT has completely revolutionized observational astronomy by imaging over 117 million stars in the disk of the Andromeda Galaxy (M31) . M31 imaging took two weeks of Hubble Space Telescope time, an unprecedented achievement given that many observational astronomers are lucky enough to get even a few precious hours on Hubble!
Now the PHAT team is ready for the second round. They moved on to neighboring Andromeda and the third most massive galaxy in our Local Group: the Triangle Galaxy, or M33. And of course, this observing program wouldn’t be complete without a catchy new acronym: the Panchromatic Hubble Andromeda Treasury: extended region of the triangle, or “PATTER”. Studying M33, in addition to M31, is beneficial because M33 had overall higher amounts of star formation and therefore can provide more information about a new parameter space previously unexplored in M31. M33 also has a lower stellar surface density (lower star-to-surface ratio AKA), so resolving individual stars is much easier in M33 than in M31. The PHATTER team has generously made its data publicly available, providing photometry (i.e. the measured flux of astronomical objects) for over 22 million stars spanning 38 kpc2 of M33.
This paper, the second in the PHATTER series (where the first described observations and photometry), measured the star formation history of M33. Measuring the star formation history of a galaxy can provide crucial information about the astrophysical phenomena that shape galaxy formation; for example, how the structure of a galaxy changes over time.
To measure the star formation rates of galaxies, astronomers have historically used two different methods. The first method consists in studying the UV emission of young massive stars. Because young stars emit primarily in UV wavelengths, UV flux is often used as a tracer for recent star formation over the past 200 million years. The second method is to study H-alpha emission, a Balmer series emission line that occurs when hydrogen electrons transition from their third to their second lowest energy level. H-alpha emission often indicates that hydrogen is ionized, usually by young O stars. Therefore, H-alpha emission traces recent star formation over the last 5 Myr. However, both of these techniques are limited by dust quenching, which can be difficult to correct.
The authors of this paper use a third innovative method to measure the history of star formation, called “CMD-based modeling”. The basic principle of this technique is that if you have high precision photometry, you can use color-amplitude diagrams (CMD, the observer’s version of the HR diagram, where instead of brightness vs. temperature, you have Magnitude versus Color) to infer the rates of star formation throughout history that would have produced a given observed population. For example, younger stars spend less time in a given color-magnitude diagram area than older red giant stars. Another useful advantage of the CMD modeling technique is that it simultaneously adapts to dust quenching, unlike UV/H-alpha methods.
To measure the history of star formation in bins on the face of M33, the authors divided their photometry into ~2,000 regions, each containing an average of 4,000 stars. To measure the history of star formation, they fit color-magnitude diagrams in each region using the MATCH software, which finds the combination of stellar populations that best produces the observed color-magnitude diagram. Using this software, the authors were able to reconstruct the star formation history of M33 by measuring the rate of star formation in slices from around 50 Myrs, up to 630 Myrs ago. While the CMD-based method requires high-resolution photometry, you can study the rate of star formation throughout history, whereas UV/H-alpha techniques only measure recent star formation.
The structure of the M33
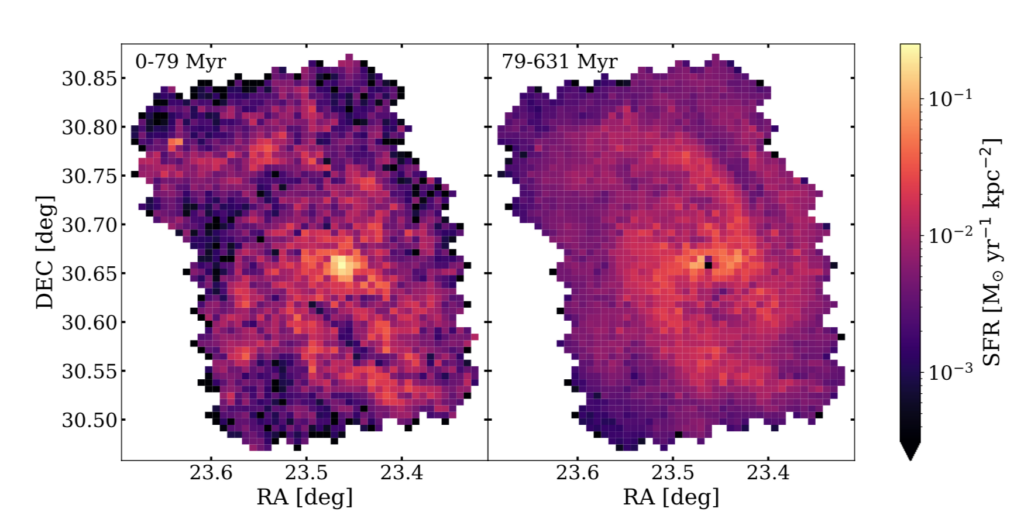
One of the things you can use detailed star formation histories for is to measure how a galaxy’s stellar structure has changed over time. M33 has generally been characterized as a flaky spiral galaxy, meaning that its spiral arms are less defined than those of a grand design spiral galaxy like M101 (see Figure 1 for a comparison of the two). However, by studying the star formation rate through The history of M33 (as opposed to recent star formation), the authors were able to reconstruct the evolution of the spiral structure of M33 using the rate of star formation measured in time intervals of approximately 50 Myr. They found that while M33 does indeed have a flaky spiral structure that formed about 79 Myrs ago, before that M33 had two distinct spiral arms. Briefly, younger stellar populations (less than 80 Myr) occur as a flaky spiral structure and older stellar populations occur primarily in two separate spiral arms. In Figure 2 you can clearly see the separation between these two stellar populations. The authors also clearly detect a bar in M33 that is older than about 79 Myr, which is important because there has been much recent debate in the literature about whether M33 has a bar. The detection of bars in galaxies has strong implications for the history of galaxy formation; the rods force a lot of gas towards the center of the galaxy, fueling the formation of new stars, creating central star bulges, and fueling massive black holes. In particular for M33, a small bar could explain the discrepancies between the models and the gas velocities observed in the inner disk. The authors suggest that more modeling be done to explain why younger stellar populations did not form in a bar, while older stellar populations did.
Finally, the authors compared their overall star formation rate (which has units of M⊙/year and measures the total mass of stars added to the galaxy each year) to that measured by conventional methods using emission UV and H-alpha. The author found that their measured value was approximately 1.6 times greater than the UV/H-alpha measurement, indicating that UV/H-alpha measurements may not capture the full star formation rate of a galaxy. In the future, the authors plan to extend this analysis by focusing on measuring the age gradient of the arms and the spiral bar of M33.
Featured image credit: NASA, edited by Abby Lee
Astrobite edited by Isabella Trierweiler
About Abby Lee
I am a graduate student at UChicago, where I study Cosmic Distance Scales and Hubble Voltage. Apart from astronomy, I like to play football, run and learn fashion design!
