 Universo Viviente
Related Articles


Sorry, astronomers: the expanding Universe doesn’t match.

The galaxies depicted in this image all lie beyond the Local Group and as such are all gravitationally independent of us. As a result, as the Universe expands, their light moves to longer, redder wavelengths, and these objects move further away, in light-years, than the number of years they are. ‘it actually takes light to get from them to our eyes. As the expansion continues unabated, they will gradually find themselves further and further away.
The biggest anomaly is the Hubble voltage.
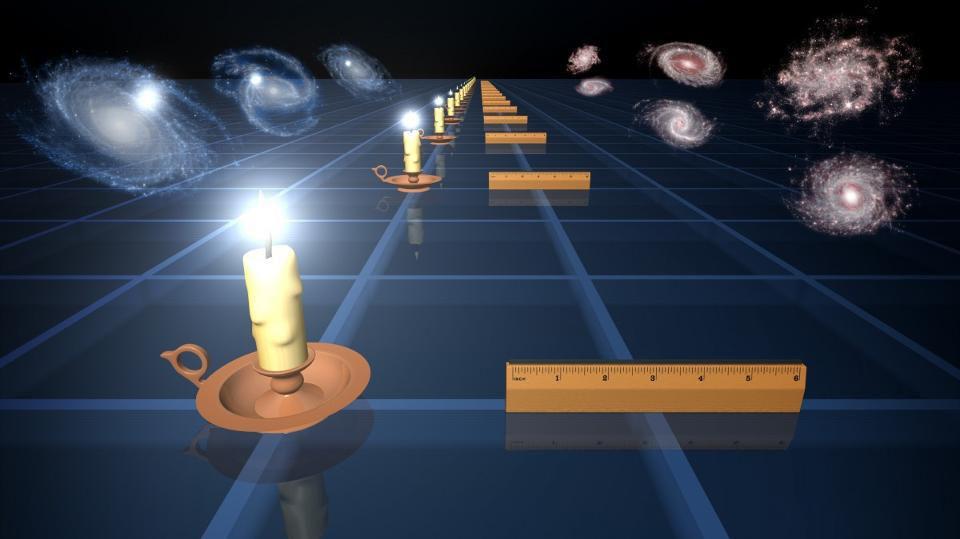
Two of the most effective methods for measuring large cosmic distances are based on either their apparent luminosity (left) or their apparent angular size (right), both of which are directly observable. If we can understand the intrinsic physical properties of these objects, we can use them as standard candles (left) or standard rulers (right) to determine how the Universe has expanded, and therefore what it is made of, at course of its cosmic history. The geometry of an object’s brightness or size is not trivial in the expanding Universe.
Two methods of measuring the rate of expansion give incompatible values.
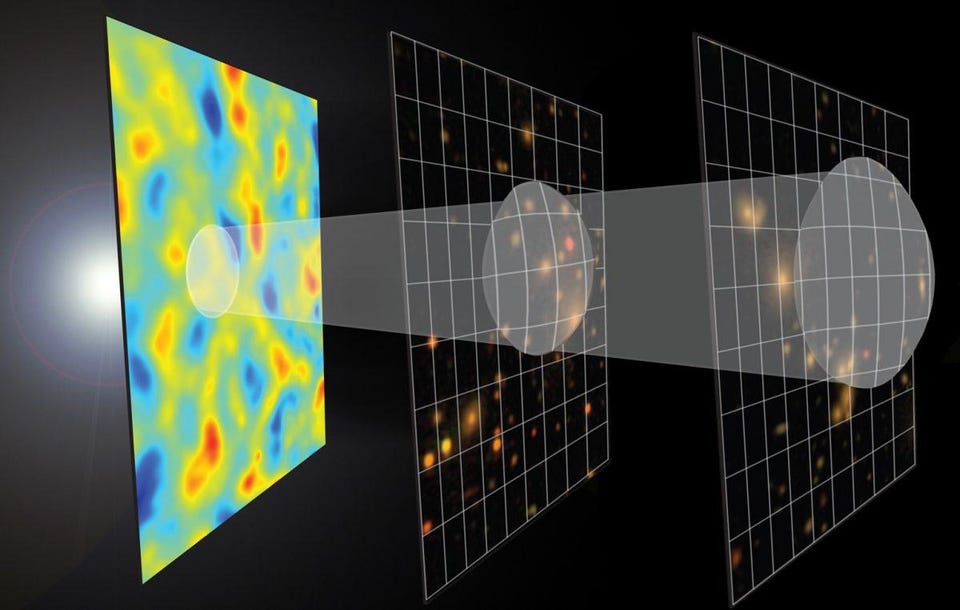
Cold spots (in blue) in the CMB are not inherently colder, but rather represent regions where there is greater gravitational pull due to greater density of matter, while hot spots (in red ) are only hotter because the radiation in this region lives in a shallower gravitational well. Over time, overdense regions will be much more likely to transform into stars, galaxies, and clusters, while underdense regions will be less likely to do so. Evidence of imperfections in the CMB and in the large-scale structure of the Universe provides a way to reconstruct the rate of expansion.
The method of primitive relics, via cosmic imperfections, gives 67 km/s/Mpc.
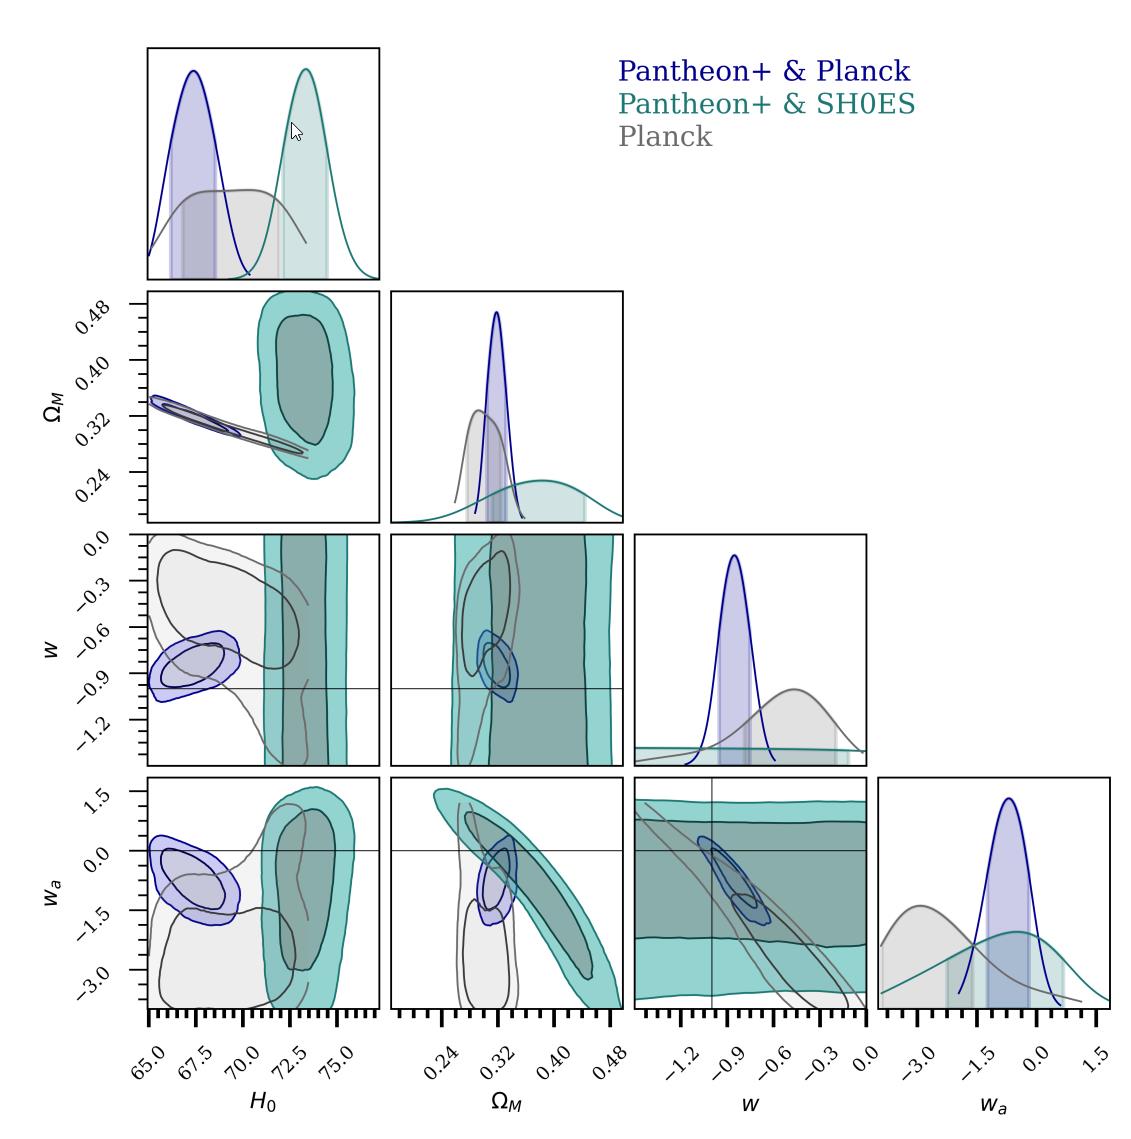
While there are many aspects of our cosmos that all data sets agree on, the rate at which the Universe is expanding is not one of them. Based on supernova data alone, we can infer an expansion rate of ~73 km/s/Mpc, but supernovae do not probe the first ~3 billion years of our cosmic history. If we include data from the cosmic microwave background, itself emitted very close to the Big Bang, there are irreconcilable differences at that time, but only at the
The distance scale method, from individually measured objects, gives 73 km/s/Mpc.

Going back in time and distance (to the left of “today”) can indicate how the Universe will evolve and accelerate/decelerate far into the future. By relating the rate of expansion to the matter and energy content of the Universe and measuring the rate of expansion, we can find a value for a Hubble time in the Universe, but this value is not a constant; it evolves as the Universe expands and time passes.
But another anomaly of cosmic imperfection is just as baffling.
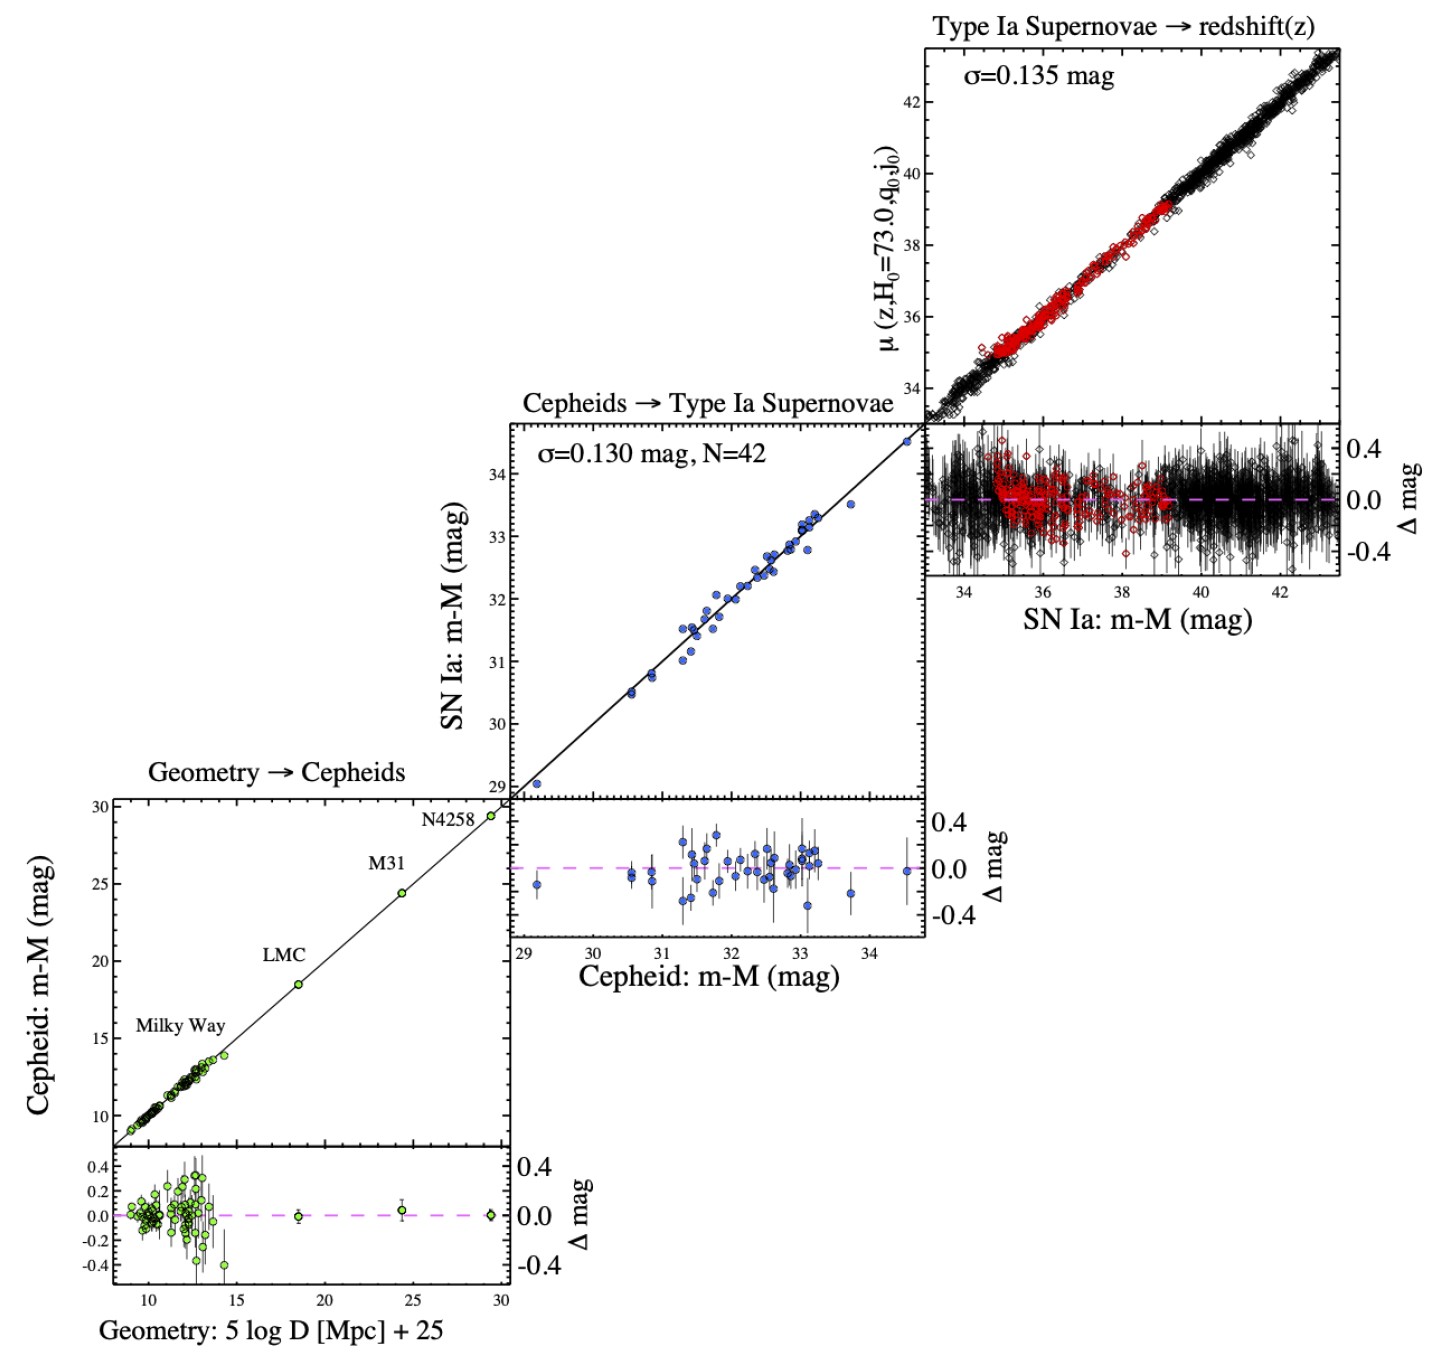
Using the cosmic distance ladder means putting together different cosmic ladders, where one always worries about the uncertainties where the different “rungs” of the ladder connect. As shown here, we’re now down just three “rungs” on that ladder, and the full set of metrics agree spectacularly.
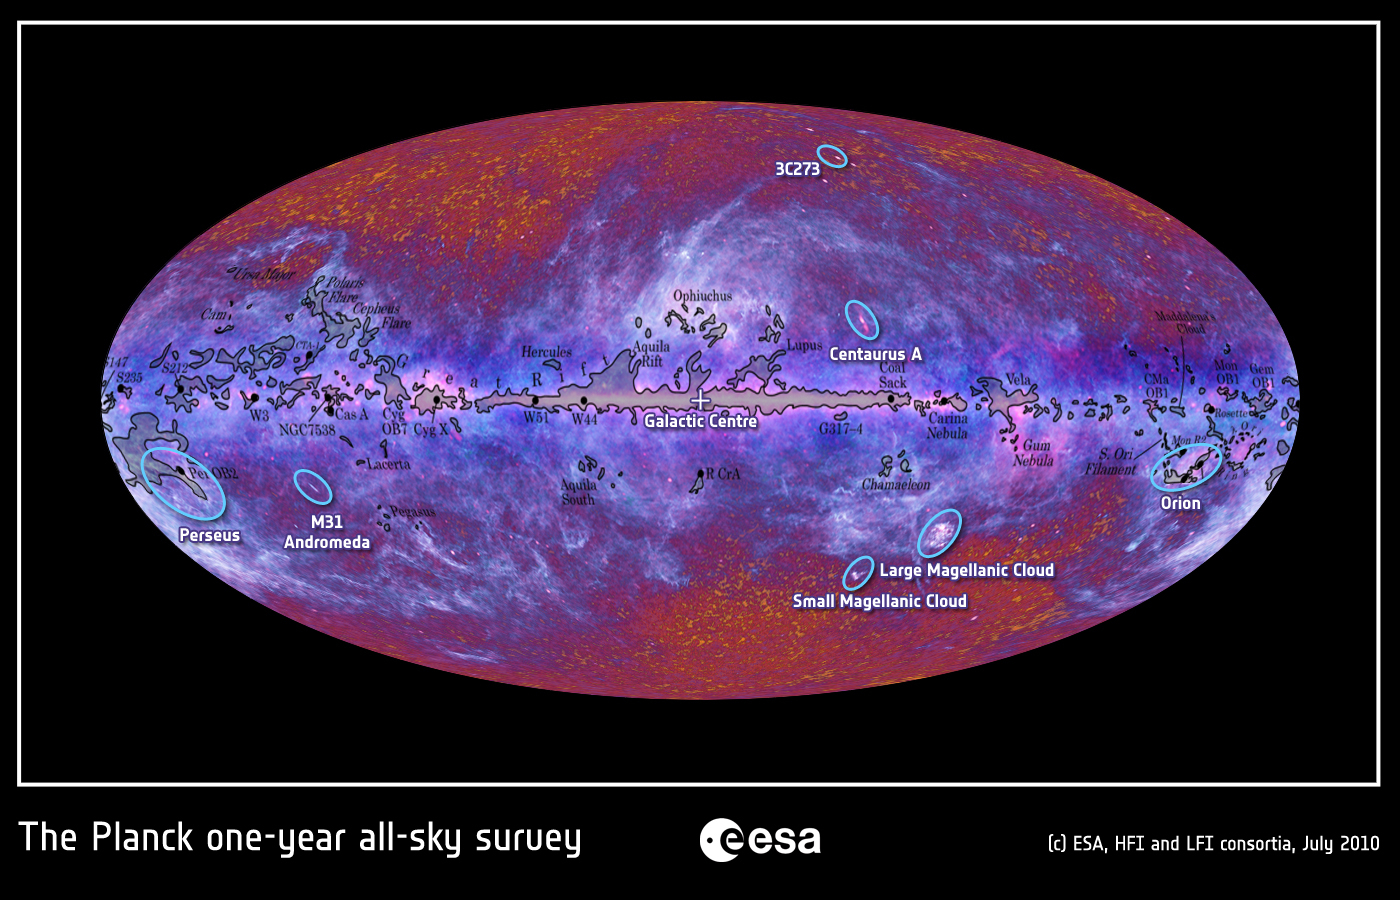
Consider the cosmic microwave background (CMB): residual radiation from the Big Bang.

According to Penzias and Wilson’s original observations, the galactic plane was emitting astrophysical sources of radiation (center), but above and below all that remained was a nearly perfect, uniform background of radiation. The temperature and spectrum of this radiation have now been measured, and the agreement with Big Bang predictions is extraordinary. If we could see microwave light with our eyes, the entire night sky would look like the green oval pictured.
Although generally uniform, one direction is about 3.3 millikelvin warmer while the reverse is also cooler.

Although the cosmic microwave background has the same approximate temperature in all directions, there are deviations of 1 part in 800 in a particular direction: which is consistent with our motion in the Universe. At 1 in 800 part of the overall magnitude of the CMB amplitude itself, this corresponds to a motion of about 1 in 800 part of the speed of light, or ~368 km/s from the Sun’s perspective .
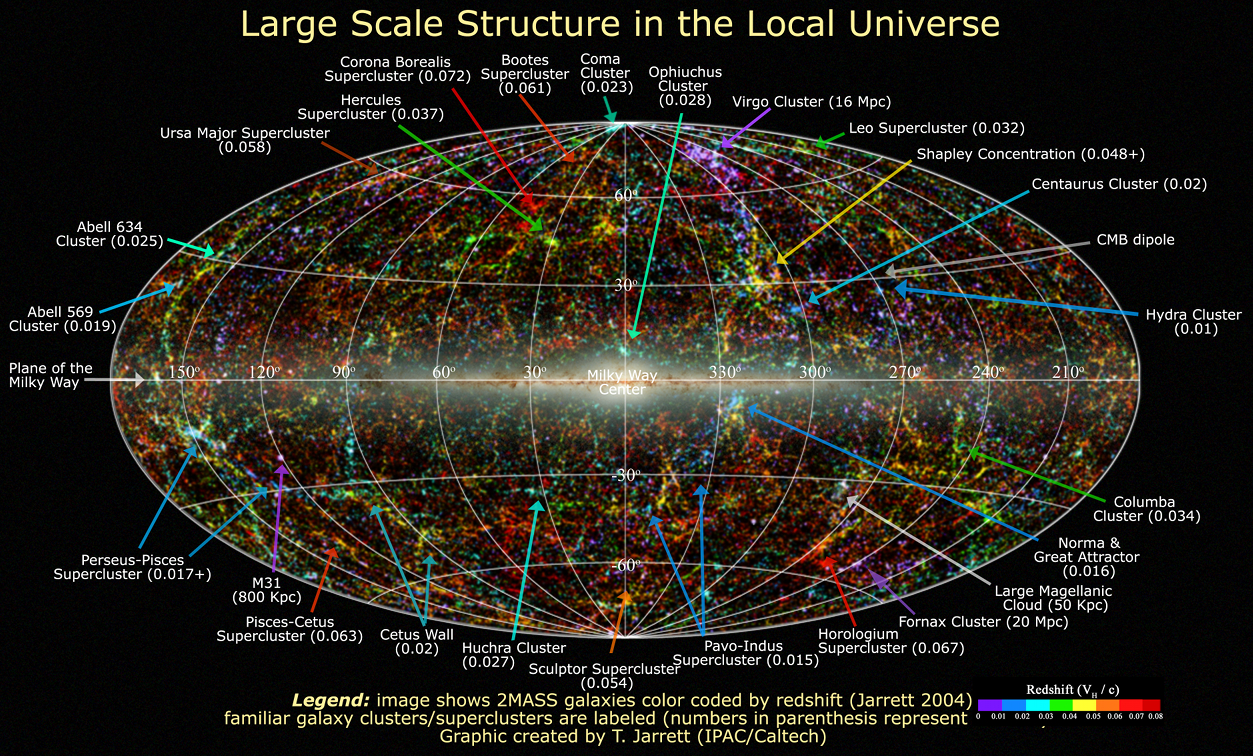
This “CMB dipole” reflects the relative motion of our Sun with respect to the CMB: ~370 km/s.

An accurate model of how planets orbit the Sun, which then moves through the galaxy in a different direction of motion. Each planet’s distance from the Sun determines the overall amount of radiation and energy it receives, but it’s not the only factor in determining a planet’s temperature. Additionally, the Sun moves through the Milky Way, which moves through the Local Group, which moves through the larger Universe.
Our local group moves much faster: ~620 km/s.

This illustrated map of our local supercluster, the Virgo Supercluster, spans over 100 million light-years and contains our Local Group, which includes the Milky Way, Andromeda, the Triangle and about 60 smaller galaxies. Overdense regions pull us gravitationally, while regions of lower than average density effectively repel us relative to the average cosmic pull.
This should be due to cosmic and gravitational imperfections tugging at us.

Because matter is distributed almost evenly throughout the Universe, it is not only overdense regions that gravitationally influence our movements, but also underdense regions. A feature known as the dipole repulsor, shown here, was only recently discovered and may explain our local group’s peculiar motion relative to other objects in the universe.
Movements of nearby galaxies consistently support this picture.
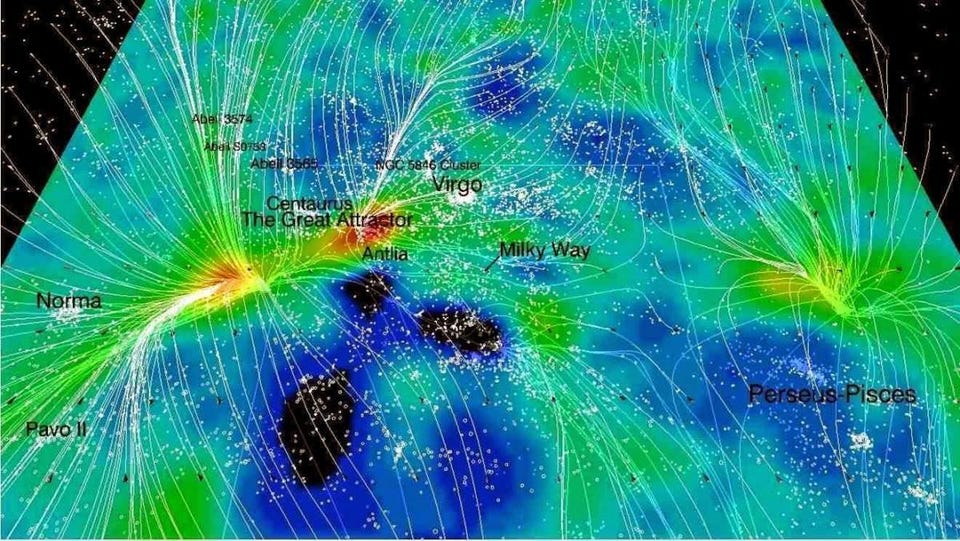
The movements of nearby galaxies and galaxy clusters (as indicated by the “lines” along which their velocities flow) are mapped with the nearby mass field. The greatest overdensities (in red/yellow) and underdensities (in black/blue) came from very small gravitational differences in the early Universe. Around the densest regions, individual galaxies can move at particular speeds of several thousand kilometers per second, but what is seen is broadly consistent with our observed local motion across the planet. Universe.
However, more distant motion tracers come into conflict with it.

At scales larger than our local supercluster, or larger than a few hundred million light-years, we no longer see differences in various directions that match our expected measured motion through the Universe. Instead, the observed effects are inconsistent, both with measurements of the local Universe and with each other in many cases.
Plasmas within clusters indicate smaller global motions: less than ~260 km/s.
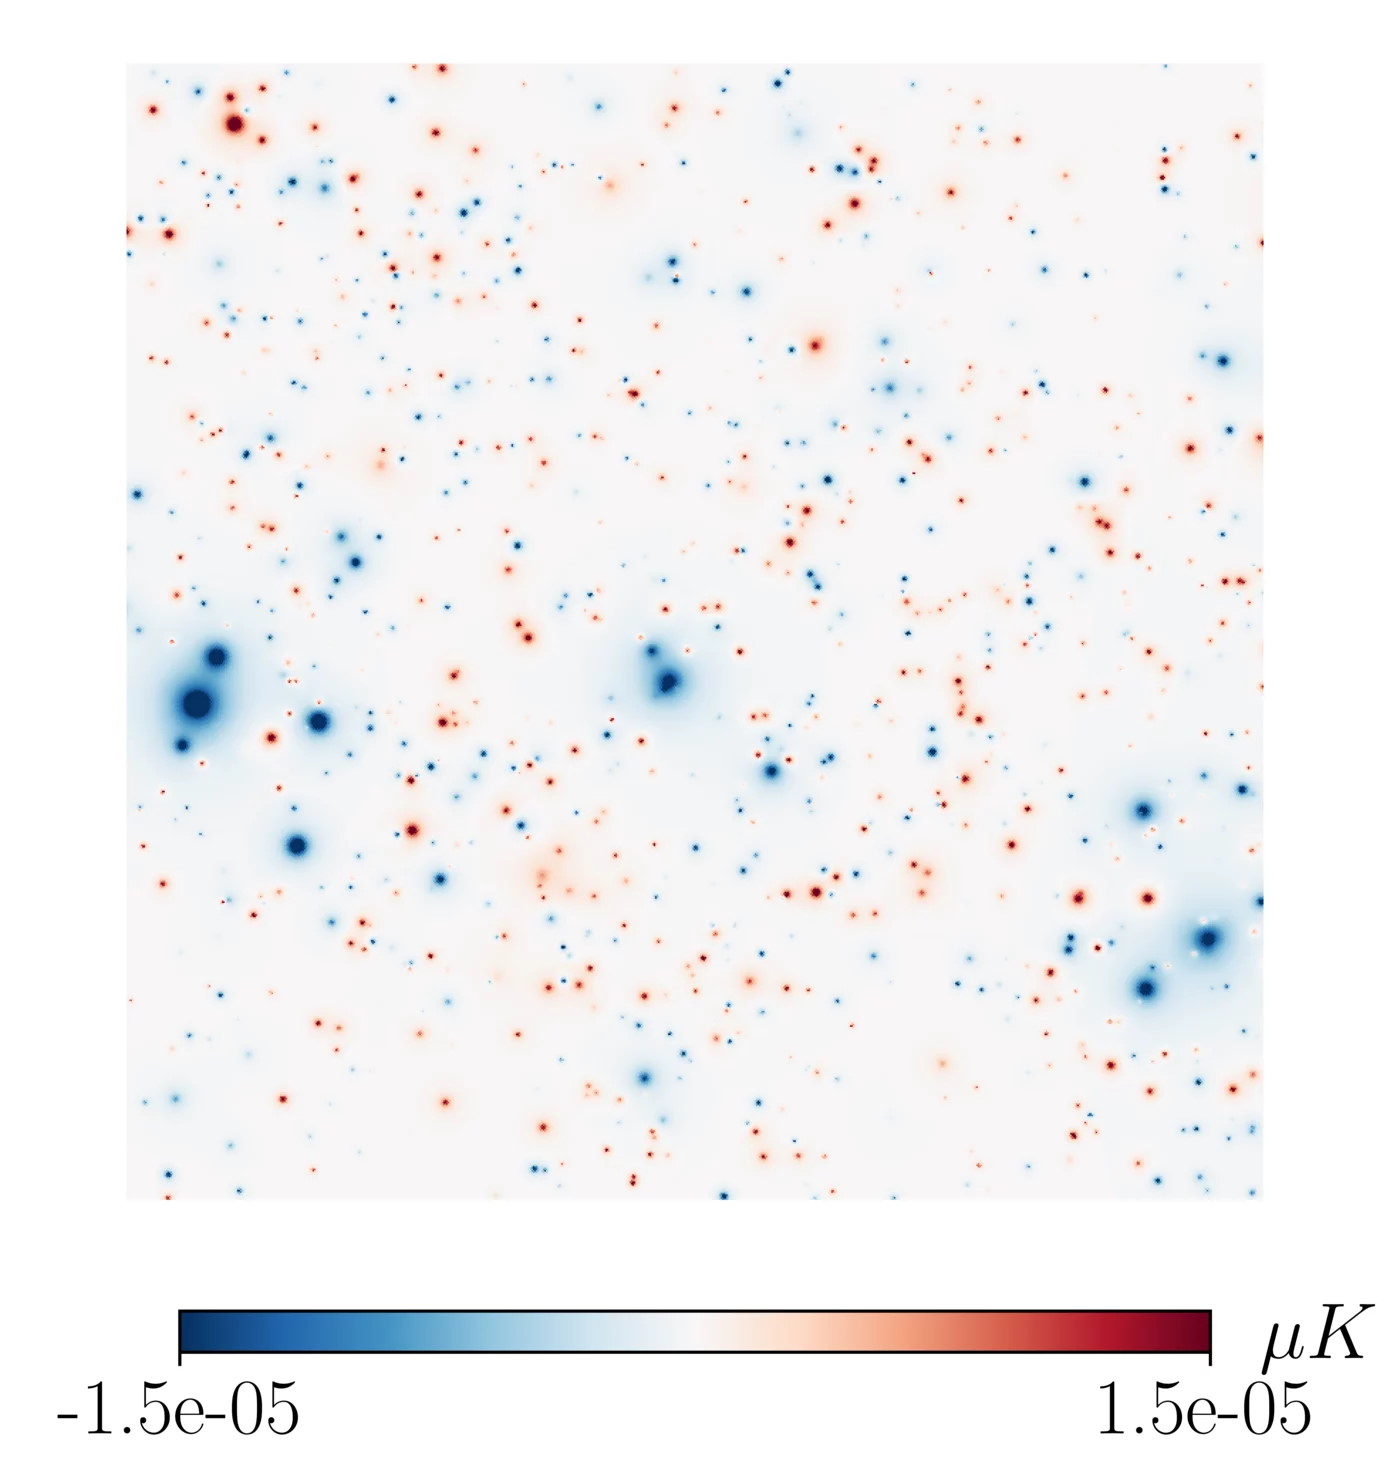
Planck satellite measurements of CMB temperature on small angular scales can reveal increases or decreases in temperature by tens of microkelvins induced by object motions: the Sunyaev-Zel’dovich kinetic effect. Clusters of galaxies, they see an effect consistent with 0, and it’s significantly weaker than you would expect from our inferred motion through the Universe.
The brighter clusters of galaxies, however, reveal larger motions: ~689 km/s.
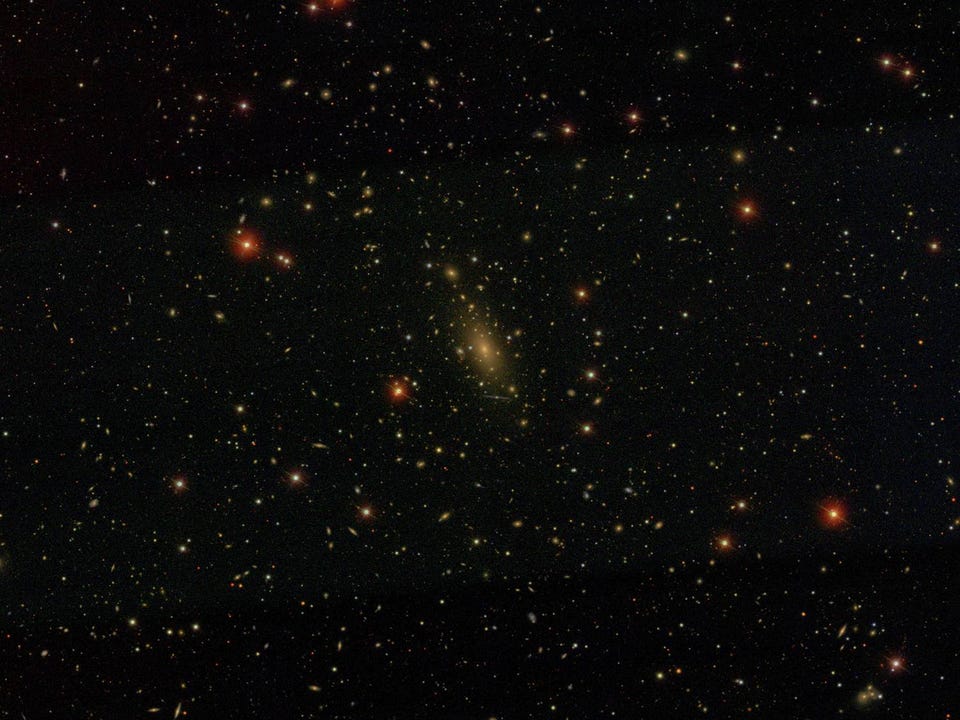
The cluster of giant galaxies, Abell 2029, hosts the galaxy IC 1101 at its heart. With a width of 5.5 to 6.0 million light-years, more than 100 trillion stars, and the mass of nearly a quadrillion suns, it is the largest known galaxy of all according to many metrics. A study of the brightest galaxy of all the Abell clusters reveals cosmic motion inconsistent with the CMB dipole.
X-ray emissions reveal giant ones (in the wrong direction!) of ~900 km/s.
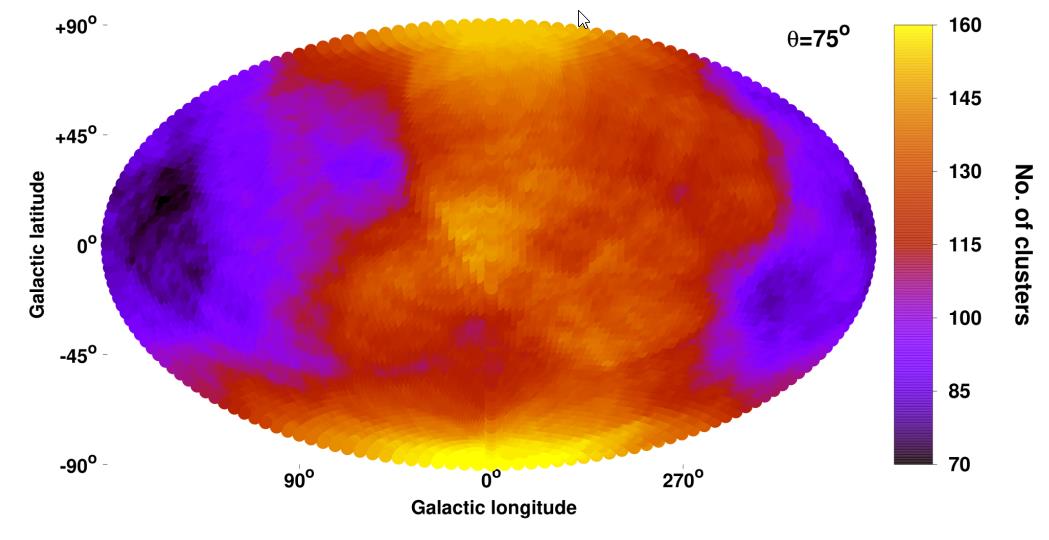
The anisotropies in the number of X-ray galaxy clusters are much larger and also in the wrong direction than expected of our motion through the Universe: another example of a surprising but important cosmological tension.
And the anisotropies in the number of galaxies reveal more than twice the expected effect.
Maps of the entire sky of galaxies reveal that there are more galaxies found at the same brightness/distance thresholds in one direction than another. This so-called flare effect has a predicted amplitude from the dipole seen in the CMB, but what is observed is more than twice the predicted effect.
The number of radio galaxies is even worse: four times the expected amplitude.
When the entire sky is observed in a variety of wavelengths, certain sources corresponding to distant objects beyond our galaxy are revealed. In radio wavelengths, galaxies can be seen in all directions, but the slight difference in one set of directions from another seems significantly larger than the difference that would be expected from our observed motion across the planet. Universe.
WISE’s quasar counts present the same problem.
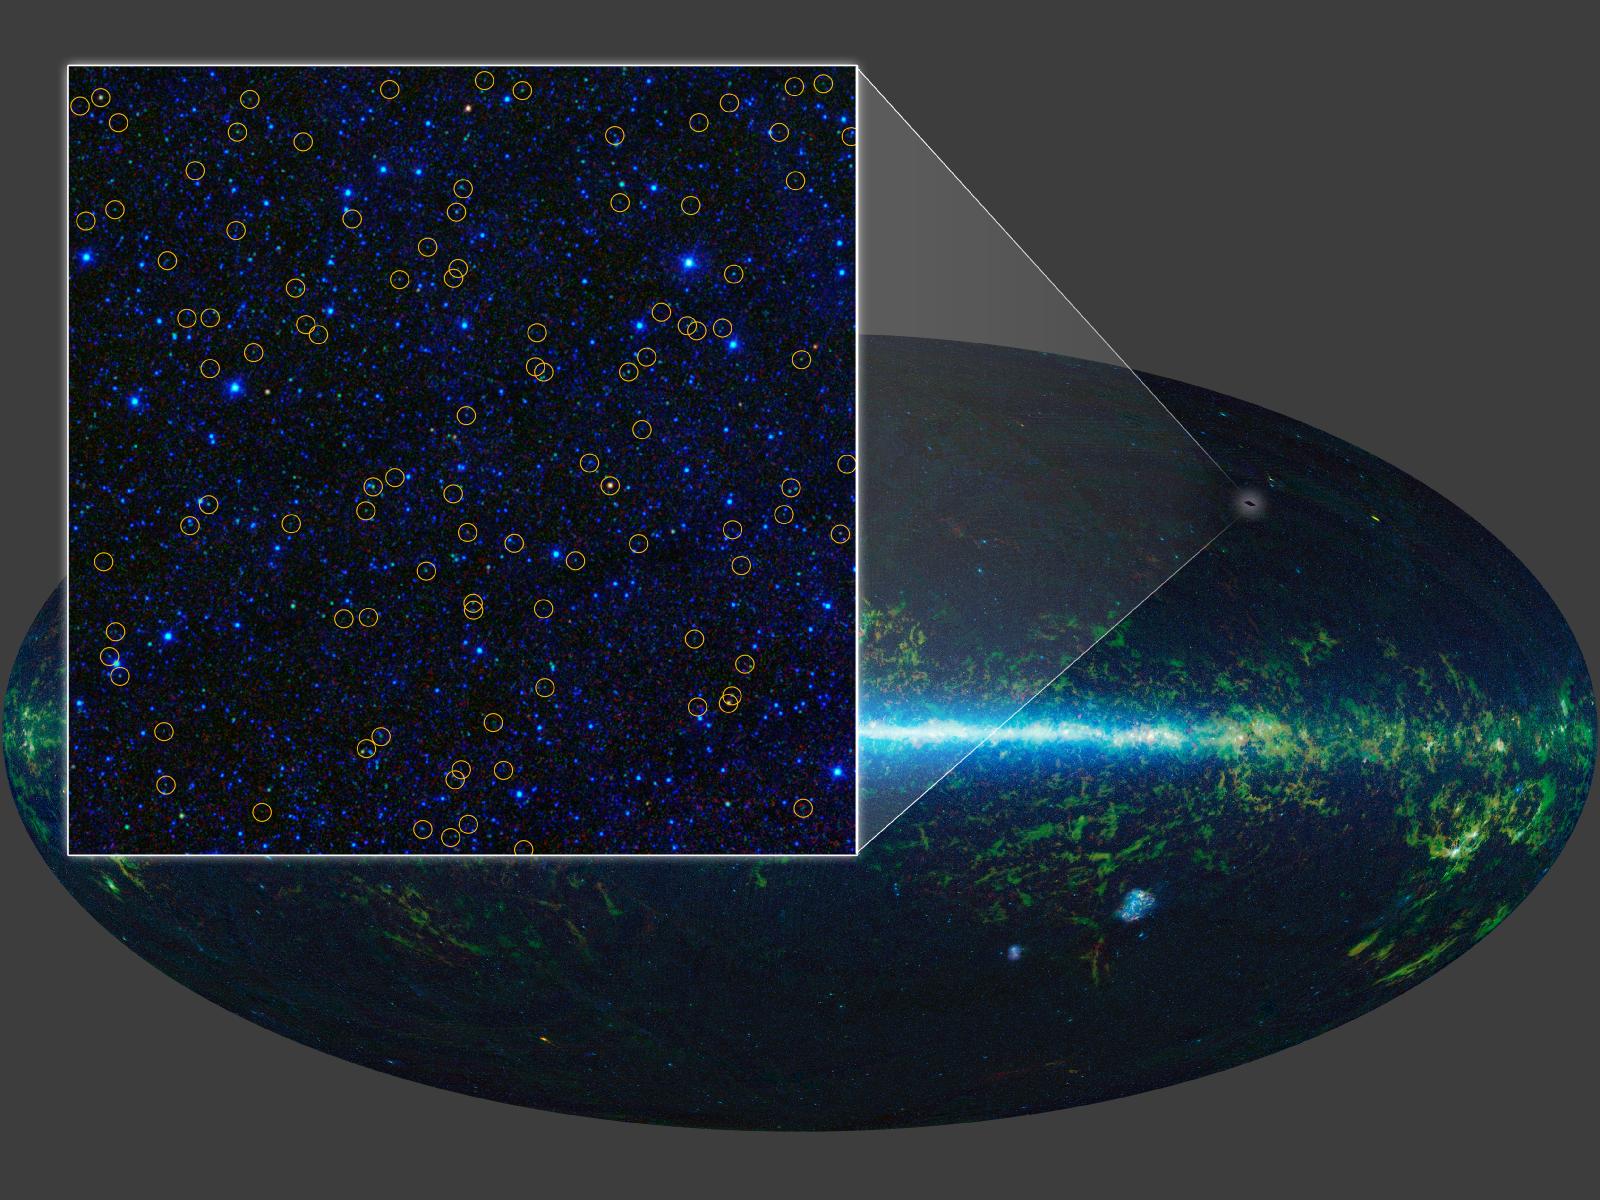
With its all-sky infrared survey, NASA’s Wide-field Infrared Survey Explorer, or WISE, identified millions of quasar candidates, identified across the sky (and shown here in a small region) with yellow circles. The clustering of quasars shows an abnormally large signal in terms of one direction having higher quasar numbers (and the opposite having lower numbers) than expected by an amount far greater than our observed motions lead us to expect .
Future larger-scale investigations may robustly confirm this second “Hubble strain.”
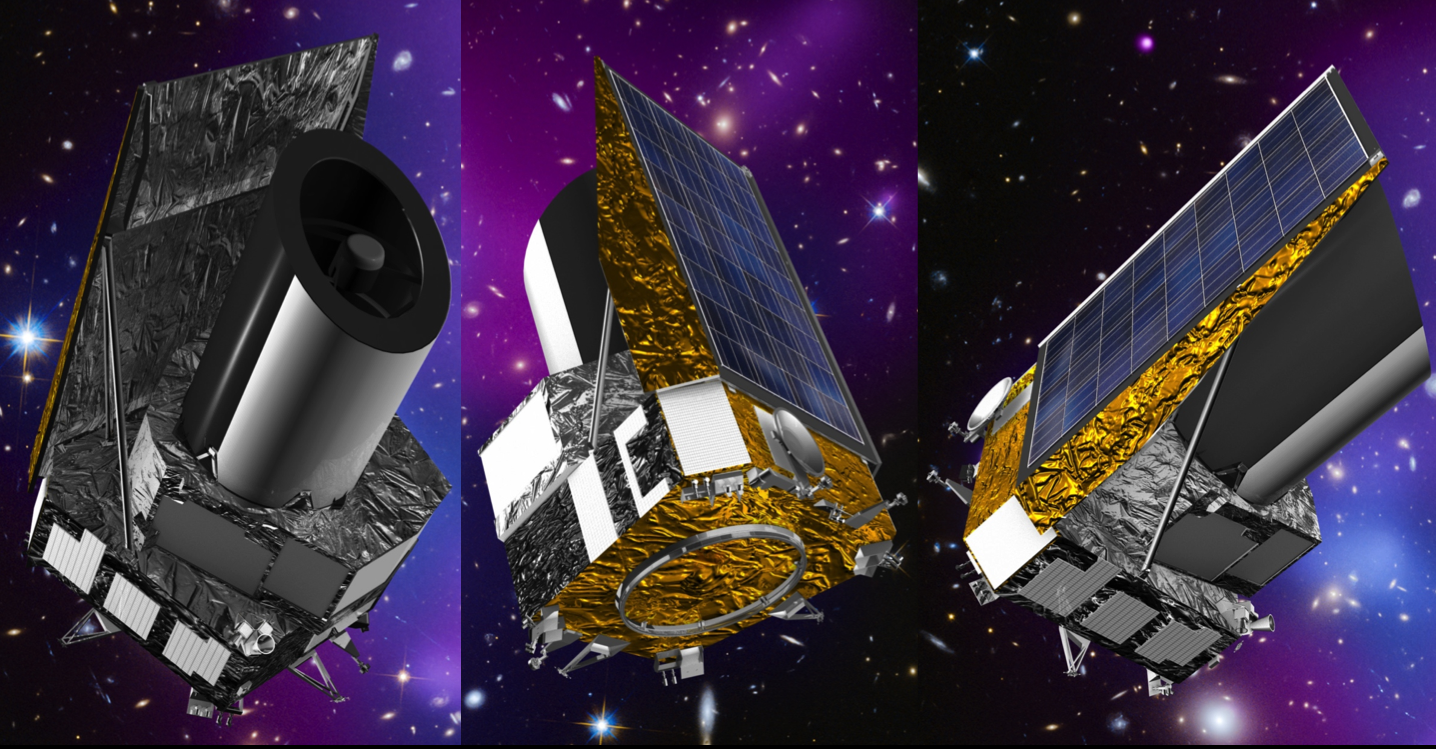
The European Space Agency’s EUCLID mission, scheduled to launch in 2023, will be one of three major initiatives this decade, along with NSF’s Vera Rubin Observatory and NASA’s Nancy Roman Mission, to map the Universe on a large scale with extraordinary magnitude and precision.
Mostly Mute Monday tells an astronomical story in pictures, visuals and no more than 200 words. Talk less; smile more.